[Top]
[Prev]
[Next]
[Index]
[TOC]
Chapter 14
 Prof: A Tool for Detailed Performance Analysis
Prof is a program performance enhancement tool in the Toolsuite. It helps
developers to improve their code performance. Unlike most other profilers that
provide approximate clock times spent while executing code, Prof provides exact
execution counts for various software items ranging from high level functions and
subroutines down to the lowest level expressions. Such execution count based
profiles provide a precise, repeatable, and easily understood way of measuring and
improving code performance. Prof uses an advanced graphical user interface to
present count ranges of the number of times code has been executed so
programmers can focus on the most executed code for possible reorganization
and rewriting to improve the code's overall performance.
14.1 Background
Programmers are frequently asked to speed up code in response to user requests for
improved performance. It seems to be inevitable that any successful system will be stressed
by larger and larger data sets until performance bounds are encountered. Execution
profiles, showing how much time is spent in each function or subroutine, are the common
way of understanding such performance limitations. Many profiling tools are available for
a wide range of languages and environments. The Prof tool utilizes the coverage data
already collected in ATAC to provide a profiling that counts the number of times each
block, decision, c-use or p-use is executed instead of an approximate clock time spent while
executing code.
In general, execution time profiling is usually done at the function level to keep down the
overhead of processing system times. Prof
presents execution count ranges for various
software items ranging from high level functions and subroutines down to the lowest level
expressions. It can point more directly to the exact code that most impacts performance.
As a result, Prof provides a precise, repeatable, and easily understood way of measuring
and improving code performance.
14.2 A Tutorial
The use of Prof is most easily understood by an example. In this section we use the same
wordcount program as used before to illustrate how the basic features of Prof can be used
to find the most frequently executed pieces of code. To copy these files, create a new
directory, cd to it, and copy the contents of the directory in which the tutorial files are
installed into the new directory. For the illustrations in this chapter, we will use (1) two c
files: main.c and wc.c, (2) three data files: input1, input2, and input3, (3) a Makefile and (4)
the tests_regress(.bat) script. Compile the wordcount program with atac as instructed in
Appendix A, Platform Specific Information.
After the compilation, two .atac files (main.atac for main.c and wc.atac for wc.c) and the
executable wordcount(.exe) are created. Note, one .atac file is created for each
instrumented .c file, i.e., the .c files compiled with ATAC.
Let us repeat all the tests executed in Section 11.2 as shown in Figure 11-1. First, remove all files with a .trace suffix. Then run the script by typing
tests_regress. Expect to see a couple of error messages during this
execution. We now invoke the graphical user interface of the Toolsuite by entering the following command:
prompt:> xsuds main.atac wc.atac wordcount.trace
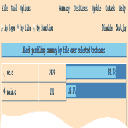
Then pull down the ``Tool'' menu and select the ``xprof'' option. Click on the ``Summary''
button in the top button bar to have a block profiling summary by file over all selected test
cases displayed in the main Prof window as shown in Figure 14-1.
In our case, although
main.c has 38 blocks and wc.c has 13 blocks, main.c is only responsible for 16.3% of the
total block execution counts whereas wc.c is responsible for the rest. You can have the
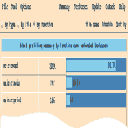
profiling summary displayed in other formats by clicking on by-type or by-function in the
middle button bar. Figure 14-2
shows the block profiling summary by functions over all
selected test cases. To see the source display of the corresponding function, click on a
function name in this summary window. Since function count in wc.c is responsible for 83.7%, let us examine it first.

|

|
Figure 14-1 A block
profiling summary by-file over all selected test cases
|
Figure 14-2 A block profiling summary by-function over all selected test cases
-
|
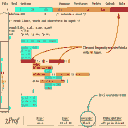
The source code of function count in wc.c is displayed in Figure 14-3. The scroll bar is a
thumbnail sketch of the entire file. Clicking with the left mouse button at the spot in the
scroll bar brings the corresponding region of the file into the source window. You can use
the arrows at the top or the bottom of the scroll bar to scroll up or down the source file a
few lines at a time. You can also drag the mouse up or down the scroll bar with the left
mouse button pressed to rapidly scroll up or down the file. In addition, Prof also provides
keyboard shortcuts. Pressing the Up or Down arrow key will move the file up or down one
line at a time. The PageUp and PageDown keys scroll up and down the file one page at a
time, respectively. The Home key scrolls to the beginning of the file, whereas the End key
goes to the end of the file.

|
Figure 14-3 Block execution counts in wc.c/count
|
The background color in Prof has a different meaning than in ATAC. In this tool it
indicates the execution frequency. For example, the red spot in Figure 14-3 indicates the
while statement is the most frequently executed code with 261 times followed by
statements in orange such as ``++nc'' or ``if (c == `\n')''
with an execution count in the range of 224-260.
Execution counts do not include those spent in system calls or other external
subroutines. Colors are assigned relative to code in that file only and the number in a color is the lowest possible number of times that code was executed.
It is your responsibility to determine whether the code in red is implemented in its most
efficient way. If not, revise it so as to improve the program's performance. Otherwise, you
can examine the next most frequently executed code to see whether it is implemented
efficiently. This process continues until the overall performance of the program is
acceptable.
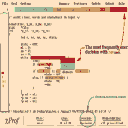
Similarly, you can view the source code at the decision, c-use or p-use level by clicking on
``Options'' in the top button bar and selecting the corresponding criterion from the popped-
up menu. Figure 14-4 shows the decision counts for function count in wc.c. As you can see
the true branch of ``EOF != (c = getc(file))'' is the most frequently executed decision with
248 times.

|
Figure 14-4 Decision execution counts in wc.c/count
|
To quit Prof, click on the ``File'' button in the top button bar, then select ``exit''.
[Top]
[Prev]
[Next]
[Index]
[TOC]
 Prof: A Tool for Detailed Performance Analysis
 Prof: A Tool for Detailed Performance Analysis